
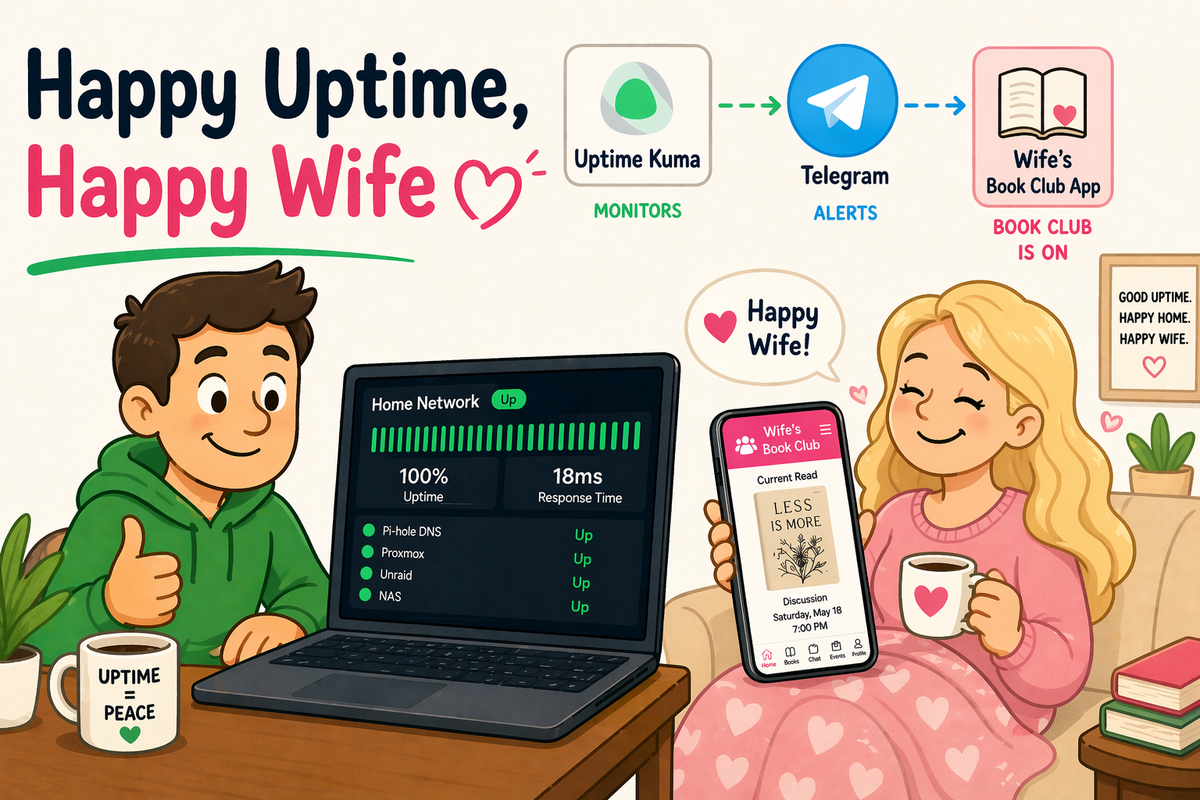
First, no pun intended. There's a specific kind of pain that comes from finding out your self hosted service has been down, not because an alert fired, but because your wife walks into your office and tells you her book club app is down.
Maybe you went to pull up your home lab dashboard and got a blank page. Maybe a friend texted asking why your shared service you're hosting wasn't working. Or maybe, in my case, the app I created for my wife's book club decided that was the perfect time to take an unscheduled crap.
If you're running a home lab, self-hosted services, or anything that people actually depend on...and yes, book club absolutely counts as critical infrastructure, you need monitoring! Not the enterprise kind where you spend six weeks configuring it before it does anything useful. The kind that takes an hour to set up and then just works in the background, quietly watching everything and yelling at your phone when something breaks.
That's Uptime Kuma and Telegram. And together, they're a surprisingly capable monitoring stack that costs you nothing and runs on a box you probably already own. More importantly, it tells me when things break before my wife does.
What Is Uptime Kuma?
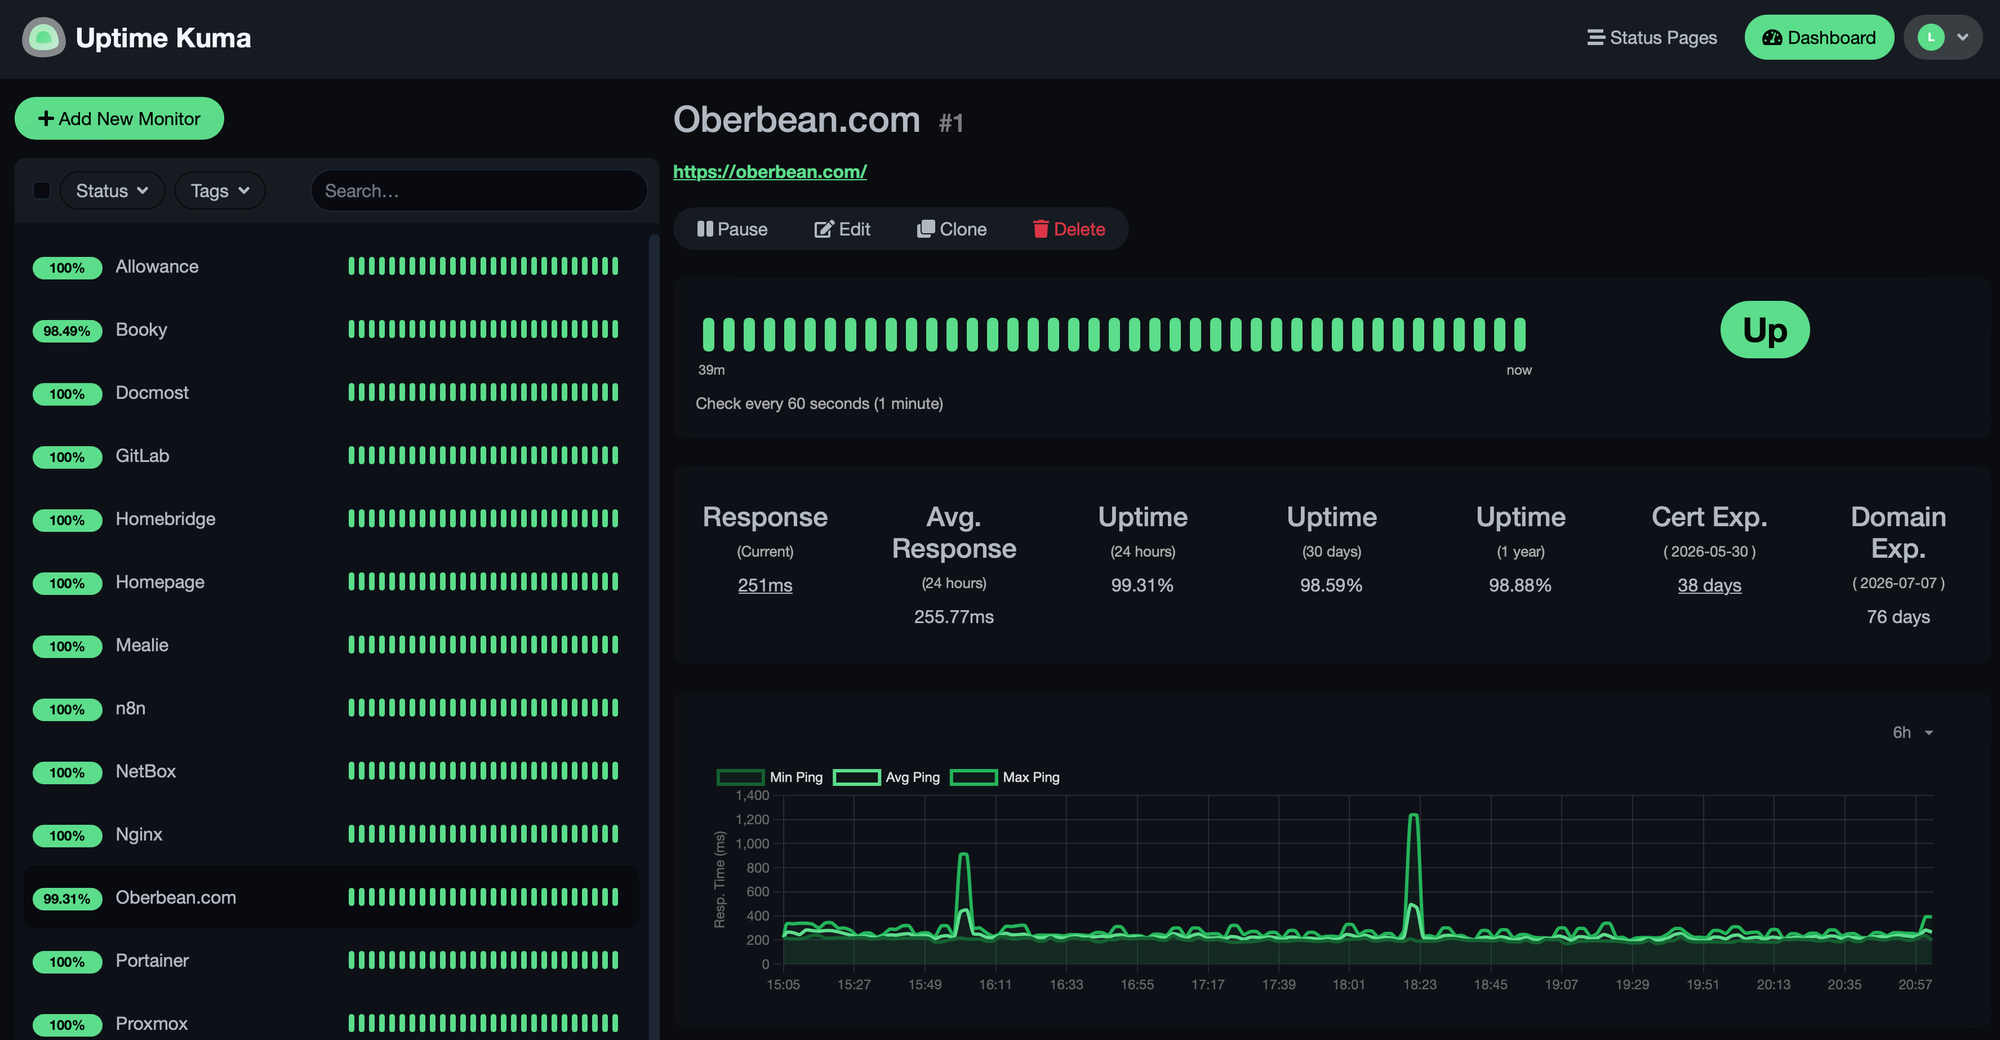
Uptime Kuma is an open-source, self-hosted monitoring tool. Think of it as your own personal uptime checker. The kind of thing you'd pay for with a public service like UptimeRobot, except you own it, it runs in your environment, and you're not capped on how many monitors you can create.
It watches things. URLs, TCP ports, DNS records, Docker containers, and ping targets. If it's something that can be up or down, Uptime Kuma can check it. It polls at whatever interval you define, tracks response times, calculates uptime percentage, and maintains a history of incidents.
The UI is clean, dark-by-default, and pretty sweet to look at. I'm not here to evaluate software by its aesthetics, but I'll note that it doesn't look like it was designed in 2009 by someone who had strong opinions about gradients. You get a status dashboard that you can keep open on a secondary monitor, share publicly, or keep entirely private.
Uptime Kuma runs as a Docker container, which means setup is exactly what you'd expect: pull the image, map a port and a volume, and it's running. There's no YAML schema to learn, no agent to deploy on every host, no licensing to think about. It's genuinely just: run it, open the browser, start creating monitors.
What Is Telegram (for Alerting)?
Telegram is a messaging platform. You've probably used it, or at least heard of it. But the reason it's relevant here isn't group chats or channels...it's bots!
Telegram has a bot API that is straightforward. You create a bot, get a token, get a chat ID, and now you have a programmable messaging endpoint that can receive messages from anything that can make an HTTP request. Uptime Kuma can make HTTP requests. You see where this is going.
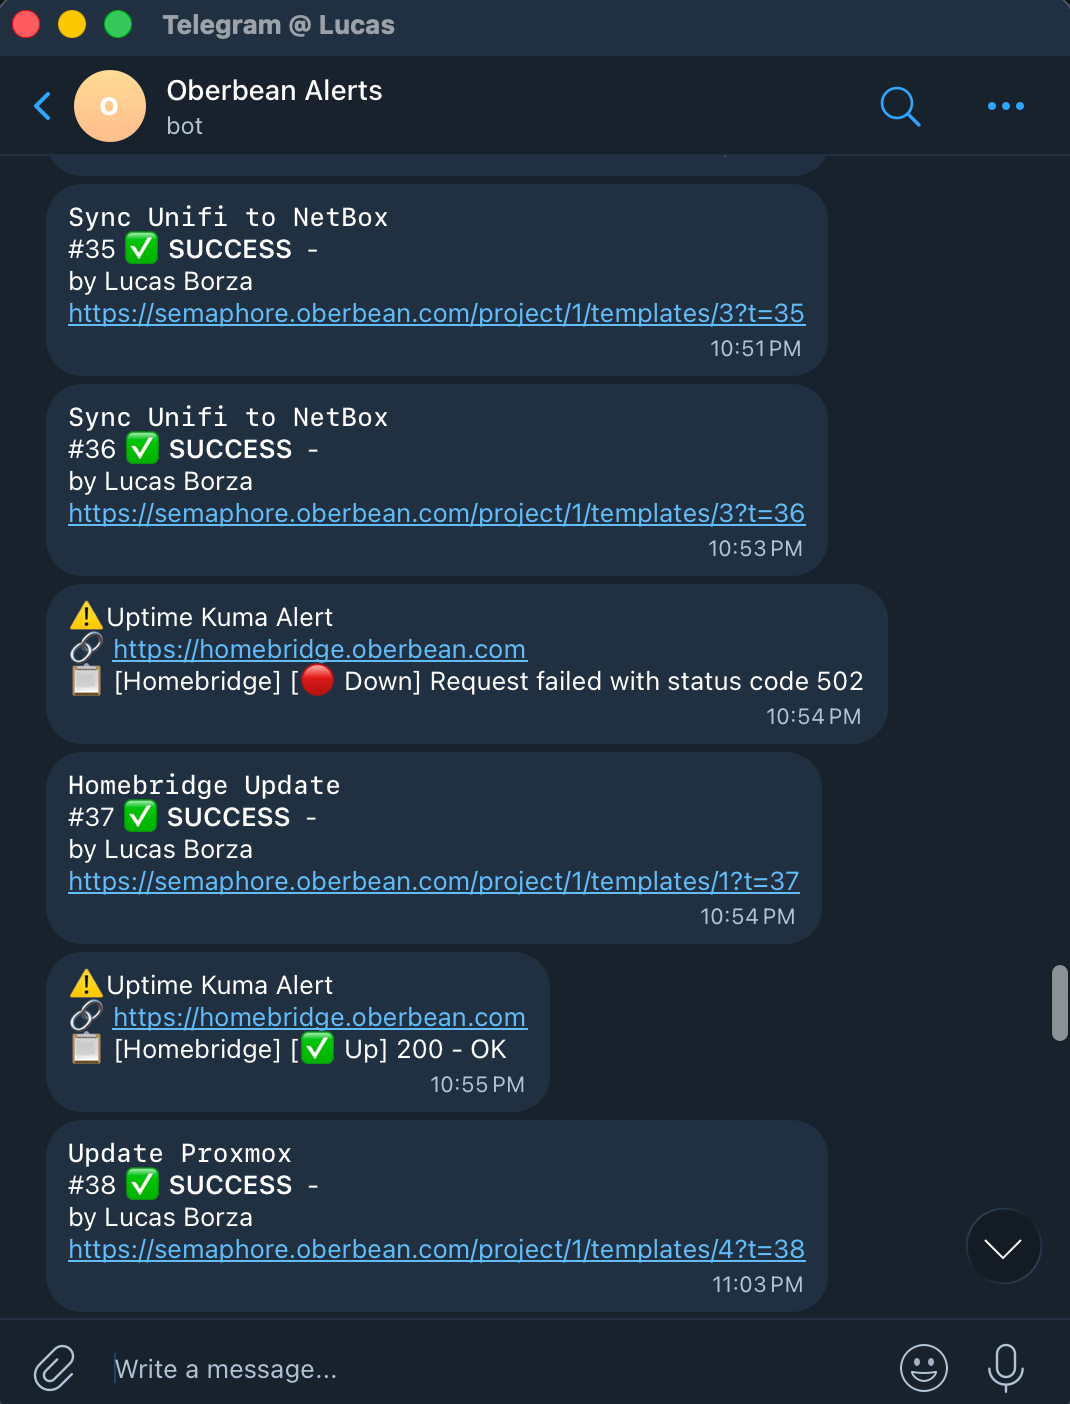
The result is that when something goes down or comes back up, you get a push notification directly to your phone. Not an email you'll read an hour later. Not a status page you have to check manually. A message, right now, that tells you the book club app is down with enough time to actually fix it before anyone notices.
It's real-time, it's free, and it works globally over the internet, which matters when the thing that just broke is the service you'd normally use to access your home network remotely.
My Setup: What I'm Monitoring and Why It Matters
I use Uptime Kuma to monitor a mix of home lab services and public-facing infrastructure. Here's what that actually looks like in practice:
Home lab services:
Proxmox hosts, NAS, APs, various Docker containers, internal dashboards, and yes, the book club app. These are HTTP/HTTPS monitors hitting internal IPs or local hostnames. If a container crashes or a service stops responding, I know immediately. Before book club night. That part is critical.
Cloudflared tunnels:
I use Cloudflare Tunnel to expose certain services publicly without opening ports on my firewall. A Cloudflared tunnel going down isn't always loud. The tunnel daemon might still be running, but if the service it's pointing to is unhealthy, requests silently fail. I monitor the public-facing URL for these services so I know the full path is working, not just that the daemon is alive. Cloudflare also alerts me which is nice via email.
Twingate tunnels:
For internal access, I use Twingate for ZTNA (Zero Trust Network Access). Twingate lets me reach internal resources from anywhere without a traditional VPN. I monitor the services accessible through Twingate to catch situations where the connector is up but something behind it isn't responding correctly. If I'm troubleshooting remotely and the service I'm connecting to is down, I want to know that before I spend 20 minutes blaming the tunnel.
Public services:
DNS records, public APIs I depend on, the oberbean.com blog itself. These are just URL monitors hitting the public endpoint. Simple, but useful.
Setting It Up
Step 1: Deploy Uptime Kuma
The simplest path is Docker Compose. Create a docker-compose.yml:
yaml
version: '3.8'

services:
  uptime-kuma:
    image: louislam/uptime-kuma:2.2.1
    container_name: uptime-kuma
    restart: always
    ports:
      - "3001:3001"
    volumes:
      - uptime-kuma:/app/data

volumes:
  uptime-kuma:
Run docker compose up -d, open a browser to http://your-host-ip:3001, and set up your admin account. That's it. You're in.
If you're exposing Uptime Kuma publicly, which I'd recommend so you can check it when you're away from home, put it behind a reverse proxy (Nginx Proxy Manager, Caddy, Traefik, whatever you're using) with TLS. Don't run a monitoring tool you depend on over plain HTTP and definitely don't expose port 3001 directly to the internet.
Step 2: Create a Telegram Bot
Open Telegram and search for @BotFather. Yes, that's the actual name. Start a conversation with it.
Send /newbot and follow the prompts. You'll give it a name, give it a username (must end in bot), and BotFather will spit out an API token that looks like:
1234567890:ABCDEFabcdef1234567890abcdef1234567890Save that token. It's the key to everything.
Next, you need your chat ID. Start a conversation with your new bot (just send it a message), then open a browser and hit this URL, replacing YOUR_TOKEN with your actual token:
https://api.telegram.org/botYOUR_TOKEN/getUpdatesYou'll get a JSON response. In there, find "chat" → "id". That number is your chat ID. It might be negative if it's a group chat. That's normal.
Save the chat ID too.
Step 3: Configure the Telegram Notification in Uptime Kuma
In Uptime Kuma, go to Settings → Notifications → Add Notification.
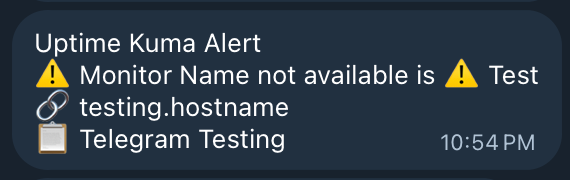
Select Telegram from the dropdown. Plug in your Bot Token and your Chat ID. Give it a friendly name. Hit Test, you should get a test message on your phone immediately.
Step 4: Add Your Monitors
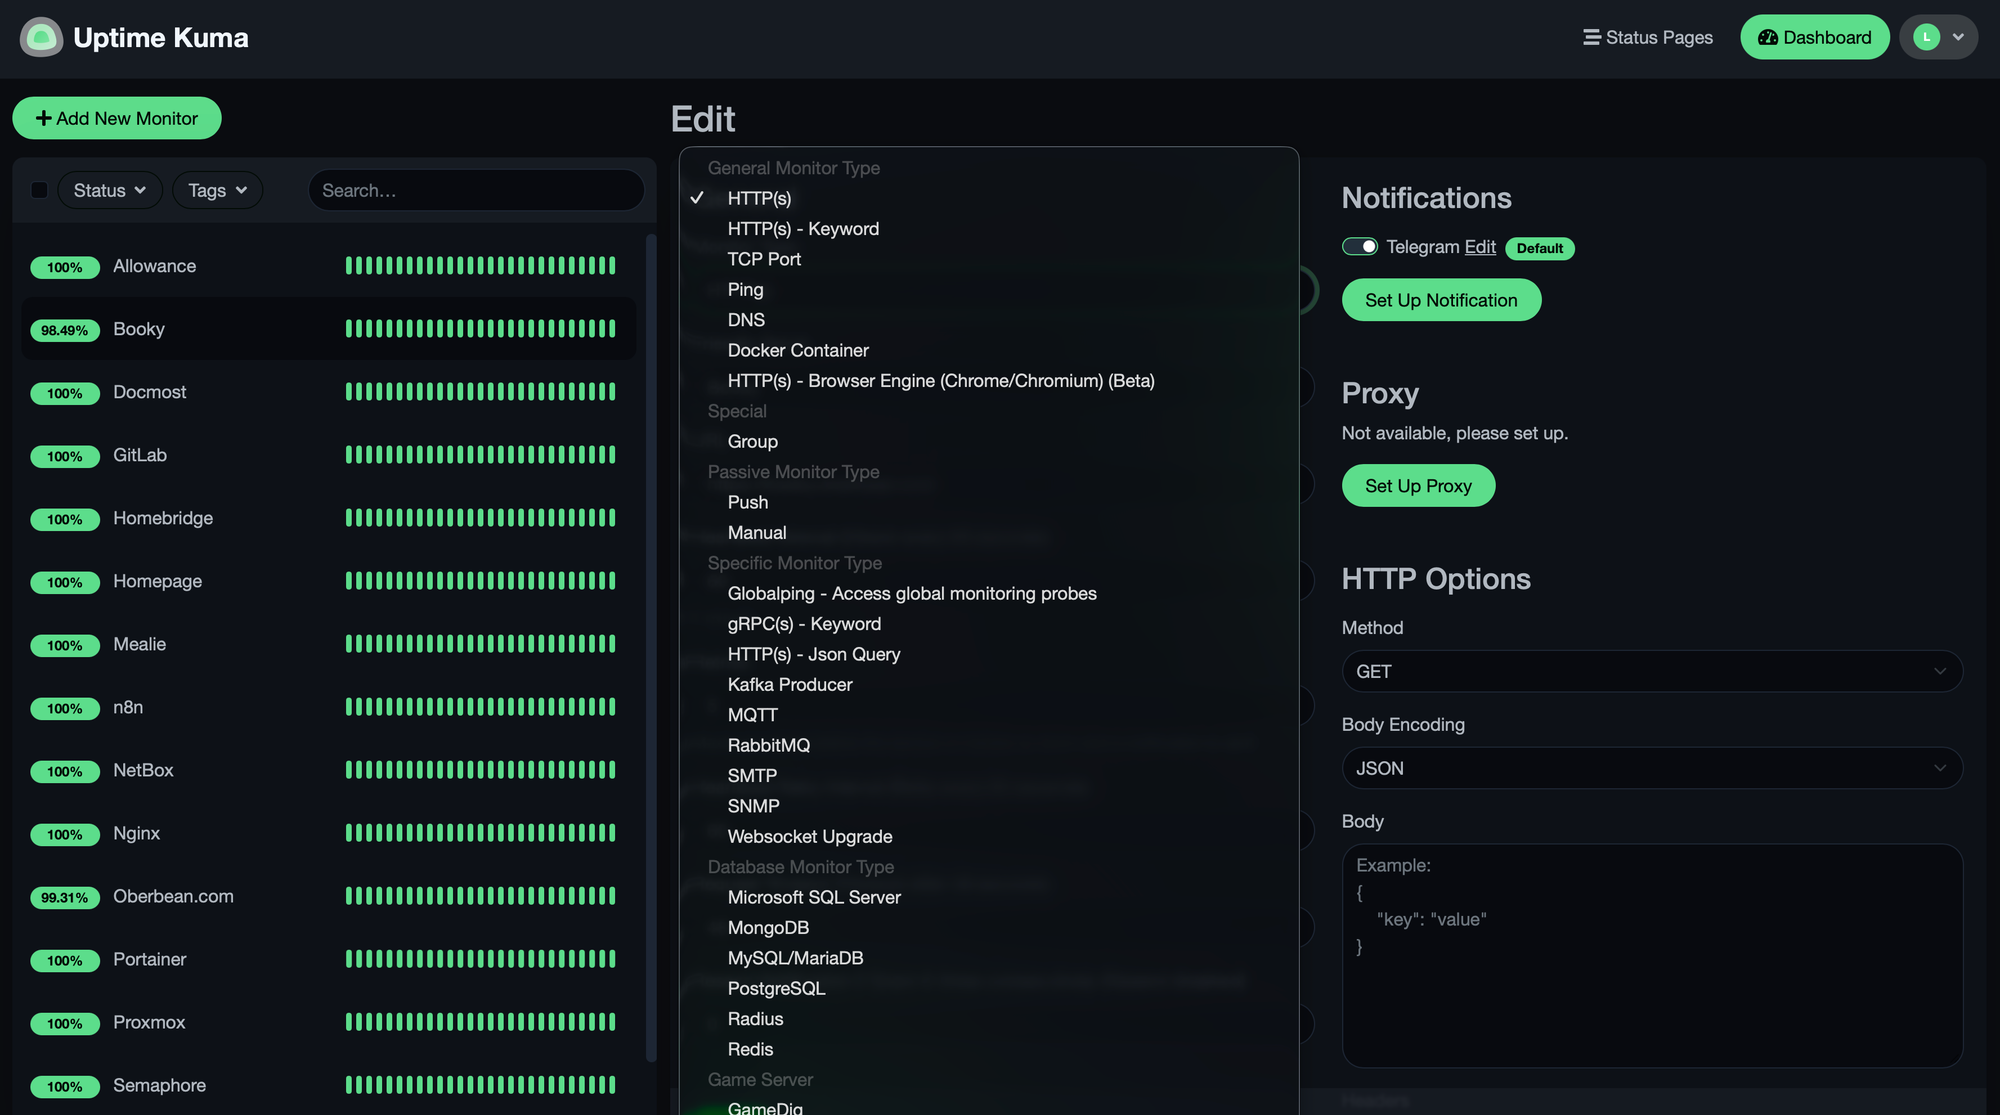
Hit Add New Monitor. The monitor types you'll use most:
HTTP(S):
For anything with a URL. Checks that the endpoint returns a response and, optionally, that the response code is what you expect or that specific text appears in the body. Use this for services, tunnels, public URLs, and anything your wife might try to open on book club night.
TCP Port:
For services that don't have an HTTP interface. Useful for checking that a port is open and accepting connections.
Ping:
For checking raw reachability. I use this for infrastructure nodes where I care whether the host is alive, not whether a specific service is running.
DNS:
For checking that a DNS record resolves to the expected value. Useful if you're running your own DNS and want to catch misconfigurations.
For each monitor, assign the Telegram notification you just created. Set your heartbeat interval (60 seconds is reasonable for most things, 30 seconds if you're impatient), and configure retries before alerting, I use 3 retries to avoid getting a 2 AM message every time a request times out once.
A Few Things Worth Knowing
You will get alert fatigue if you're not thoughtful about retries. Set your monitors to retry 2-3 times before triggering the notification. A single missed heartbeat happens. Three in a row means something is actually wrong.
Monitor the endpoint the user sees, not just the component you control. If your Cloudflared tunnel is proxying to a service that crashes, the tunnel is still "up" from the daemon's perspective. Monitor the URL that the tunnel exposes so you're testing the whole path.
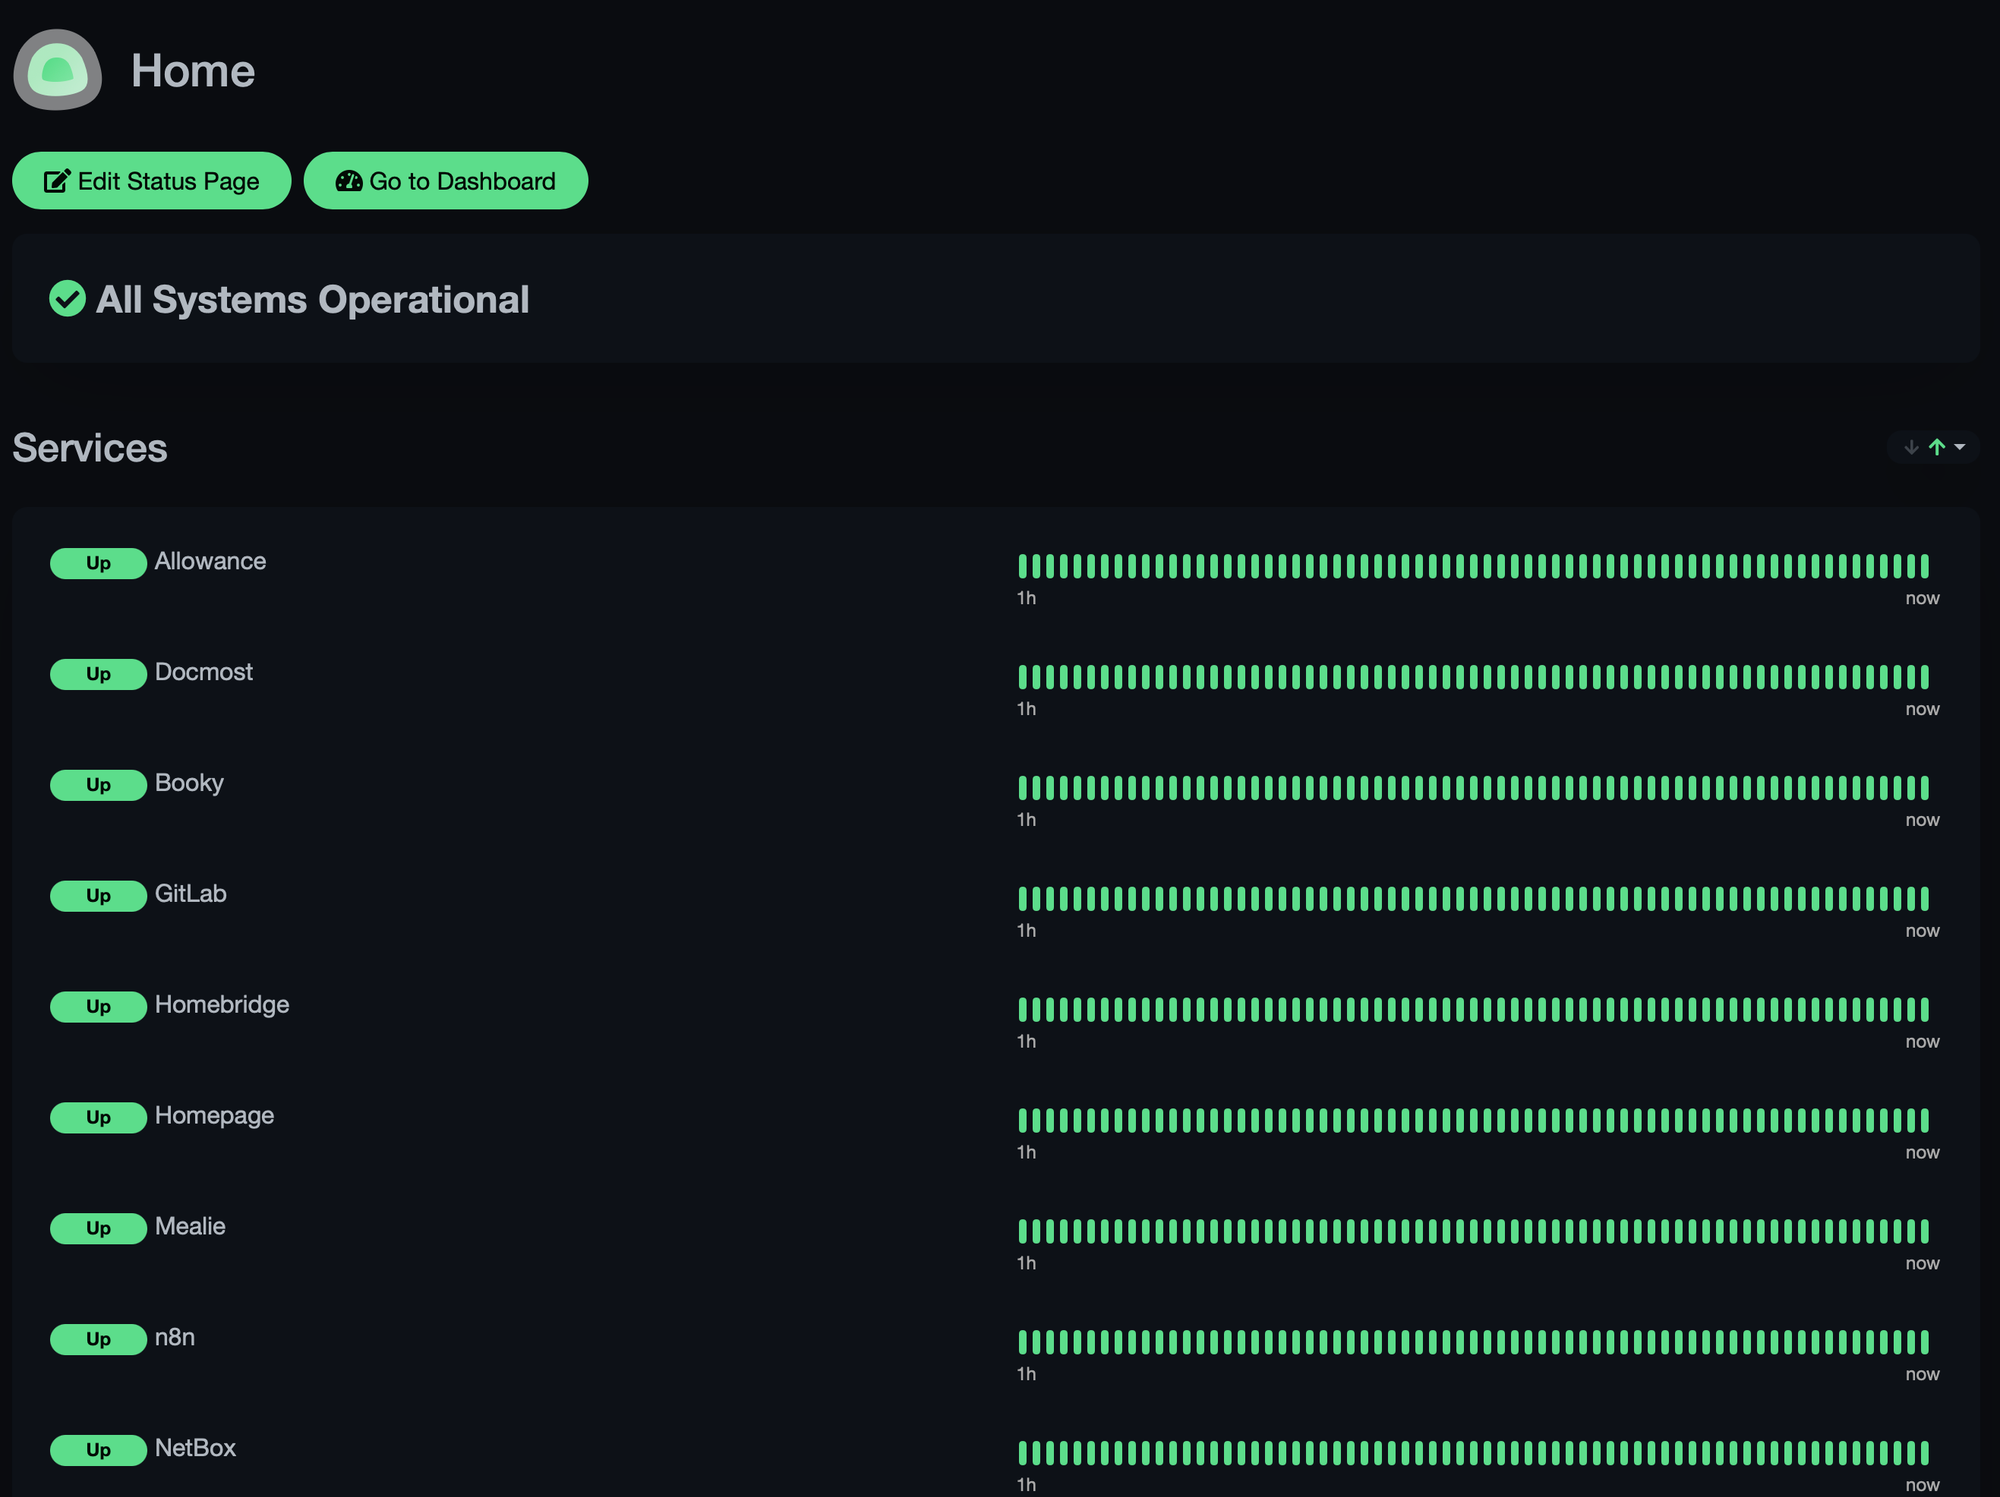
Uptime Kuma has a Status Page feature that lets you create a public or private page showing the health of all your services. Useful for sharing with people who use your services, or just for having a clean view when you want to check everything at once.
Telegram group chats work too. If you want alerts going to a group with a partner or a friend who also relies on your services, just add the bot to the group and use the group's chat ID. Everyone in the group gets the notification. I have not done this because I don't need my wife getting the same alert I do and then asking me why I haven't fixed it yet.
Why This Stack Specifically
I've used other setups. Healthchecks.io is good. Grafana + Prometheus is powerful but complex. Zabbix exists if you enjoy spending a weekend configuring something.
What Uptime Kuma gives you is the right balance of simple to operate and capable enough for a home lab or small production environment. You're not configuring alert rules in YAML. You're not managing a scrape config. You click, you fill in a URL, you assign a notification, and it works.
The Telegram pairing works because it's instant and it's already on your phone. I've gotten Uptime Kuma alerts when my containers crashed. That's the point...when something at home breaks, you find out from Telegram, not from your wife standing in the doorway holding a book and a disappointed expression.
If your services are important enough to run, they're important enough to know when they're down. Especially if your wife expects her application to be online.